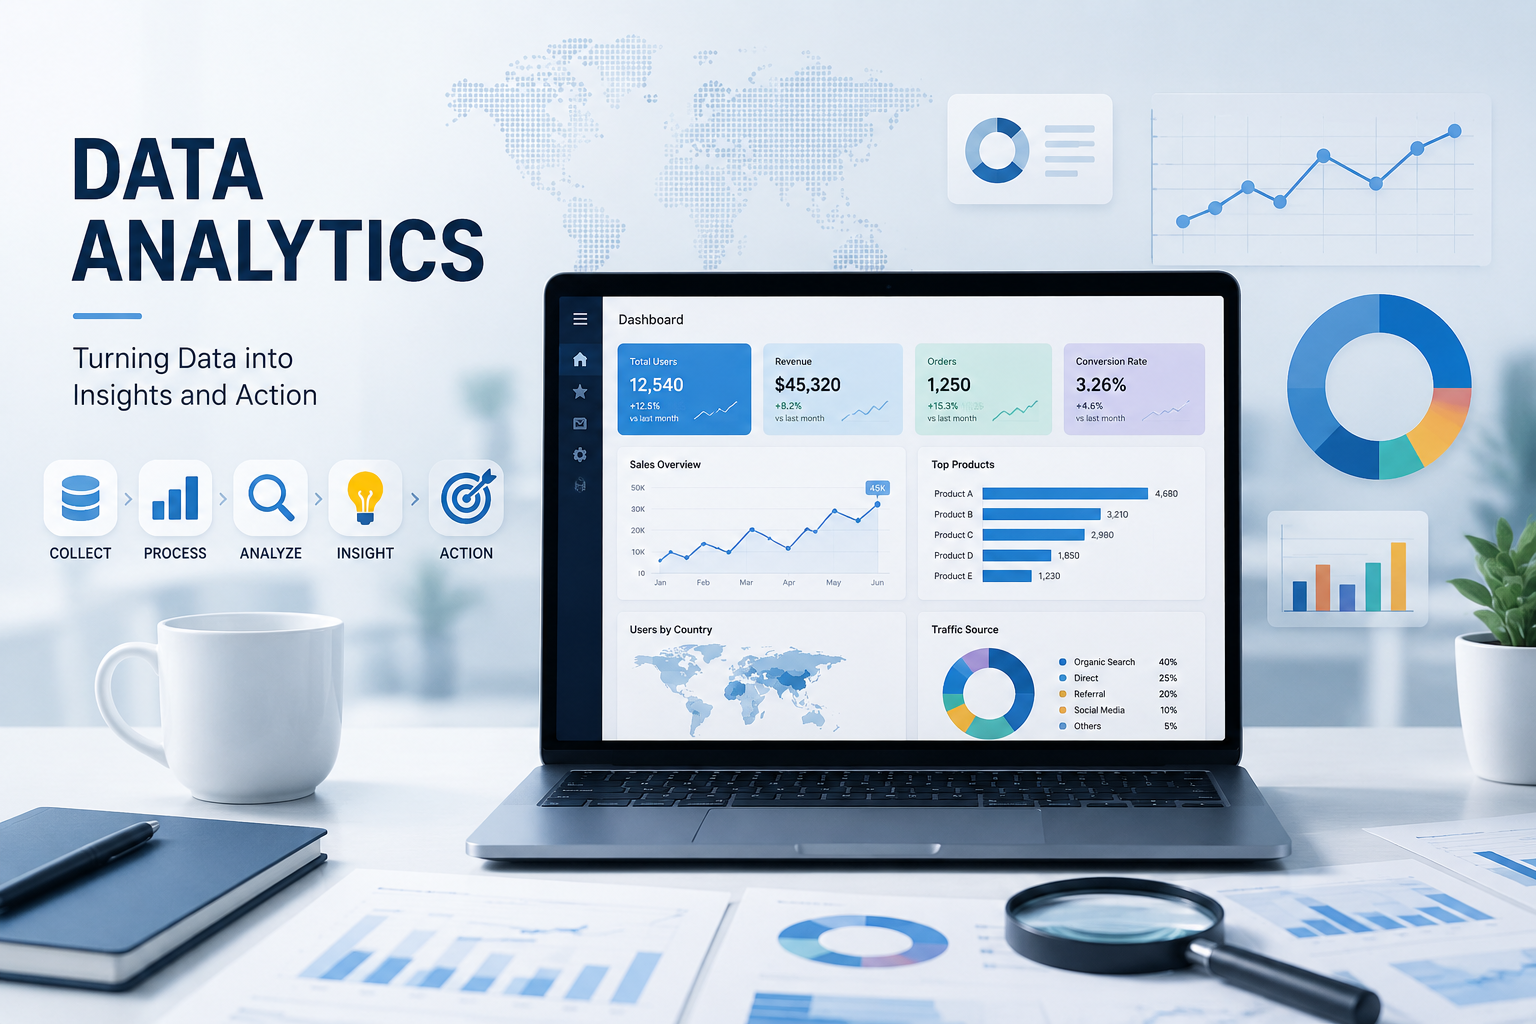
Build practical data analytics skills and gain
hands-on experience with modern tools used by
organizations to drive smarter business decisions.
Data Analytics
Intermediate
10 Weeks
Hands-On Projects
Learn how to transform raw data into actionable
business insights using industry-leading tools
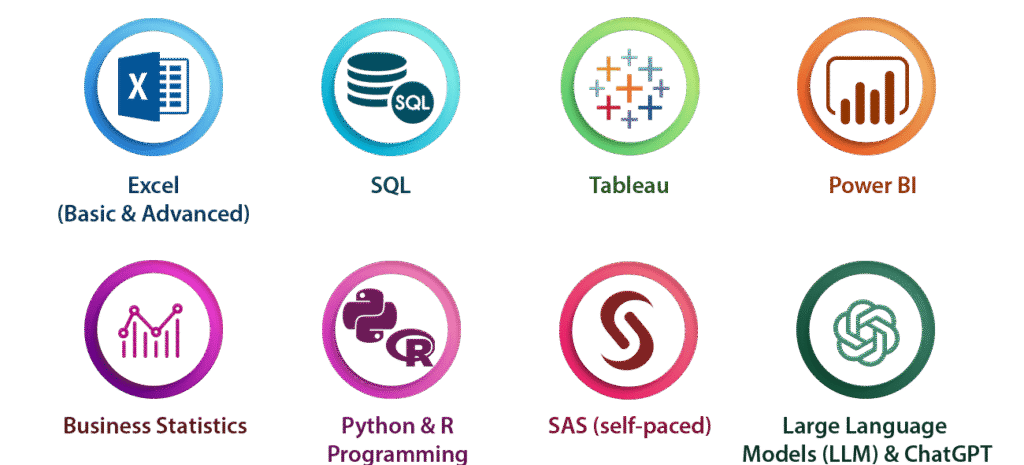
such as Excel, SQL, Power BI, Tableau, and Python.
Develop practical analytical skills through
real-world datasets, interactive dashboards,
data visualization, and business reporting projects.
This program helps learners build strong
data analysis and visualization skills while
gaining hands-on experience with tools used by
modern organizations for data-driven decisions.
What You'll Learn
Master the essential skills required to collect,
analyze, visualize, and communicate data insights
using modern analytics tools and techniques.
Data Analysis
Analyze datasets using Excel, SQL, and Python techniques.
Data Visualization
Create interactive dashboards using Power BI and Tableau.
Business Intelligence
Transform data into actionable business insights and reports.
Analytics Projects
Work on real-world datasets and portfolio-ready projects.
CURRICULUM
01 — Excel & Data Foundations
• Advanced Excel: formulas, Pivot Tables, VLOOKUP/XLOOKUP & data validation
• Data cleaning: handling duplicates, missing values & formatting inconsistencies
• Charts, conditional formatting & dashboard creation in Excel
• Analytical thinking: understanding business problems before analyzing data
02 — SQL For Data Analysis
• SQL fundamentals: SELECT, WHERE, JOIN, GROUP BY & ORDER BY